CPU History
While debugging the X16 you can view the previous 1000 CPU operations.
Note: This can only be viewed while there is an active debugging session.
How To Open
To open the view, open the command palette and select BitMagic: Open The History View. Consult the VSCode documentation on how to customise access to that and other commands.
Click Update to display the history. If BitMagic knows where the opcode came from, when you hover over it with your mouse it will appear as a ‘link’. Click on it to be taken to the source.
How To Interpret The Data
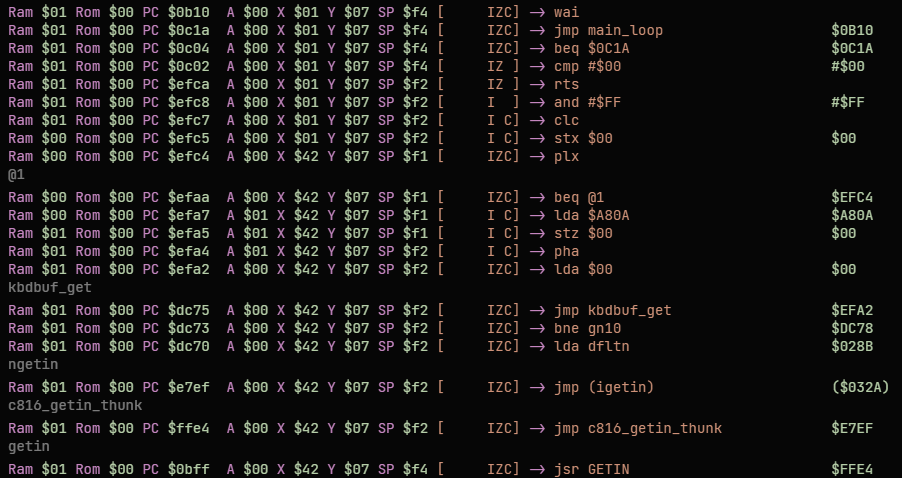
For easier use the history runs inverse to how a normal log-file works, with the most recent operations at the top so as you go down the older they get.
The registers, flags and the ram \ rom bank are as they were before the instruction completed. So to know the outcome, check the entry above or if the last entry check the current state of the machine.
The opcode shows both the decompiled version and the raw value, so will include any symbols present. The grey names are if the PC is at a known label. So int he example above you can see the code is jumping to various places in memory, such as kbdbuf_get and you get the confirmation that the jump has occurred.
The data shown on the display is packed into a 16 byte structure but only 12 bytes are used. If anyone has any ideas how to use these last 4 bytes, please let me know!