The Debugger

You can debug your applications from within VSCode, like you would any modern language. Because we use VSCode to provide the IDE, it means we can leverage the interface to provide the best developer experience possible.
Host system compatibility
The machine must have a x64 CPU, as the underlying emulator is written in x64 assembler.
Windows and Linux are both supported. Linux is tested on Ubuntu.
Apple devices are not supported, but if it’s x64 based it might work. Try overriding the system check via VSCode’s settings menu and let me know!
Installation
Install BitMagic opens the extension straight in VSCode; or search for BitMagic in the Extensions view. It is published to both the VSCode marketplace and Open VSX, so VSCodium and other Open VSX based editors can install it too.
By default it downloads its own copy of the .NET runtime and the official emulator. Both can be overridden in the settings.
Getting started
Run Create BitMagic Project from the command palette to scaffold a project, then press F5. The full walkthrough is in Getting Started; once a session is running, Debugging covers stepping, breakpoints, disassembly, the memory hex editor and jump-to-cursor.
The launch config
F5 runs whatever is selected in VSCode’s Run and Debug panel, and that comes from a launch configuration in .vscode/launch.json in the workspace. Create BitMagic Project writes one for you, so normally there is nothing to do here. Set one up by hand when you are adding BitMagic to an existing folder, or want a second configuration.
To add one, either use Run > Add Configuration and choose the BitMagic entry, or paste this object into the configurations array in .vscode/launch.json:
{
    "type": "bmasm",
    "request": "launch",
    "name": "Debug Application",
    "program": "${workspaceFolder}/project.json",
    "stopOnEntry": false,
    "debugArgs": [],
    "cwd": "${workspaceRoot}"
}
typeis alwaysbmasm. It is what hands the session to the BitMagic debugger.programis the project file, normallyproject.jsonat the workspace root. It can instead point straight at a.bmasmfile, which then becomes the only source. An emptyproject.json({}) is valid and boots to the BASIC prompt.debugArgspasses extra arguments through to X16D.stopOnEntrypauses the session at its very first instruction instead of running straight through. Off by default.cwdis the working directory for the session.
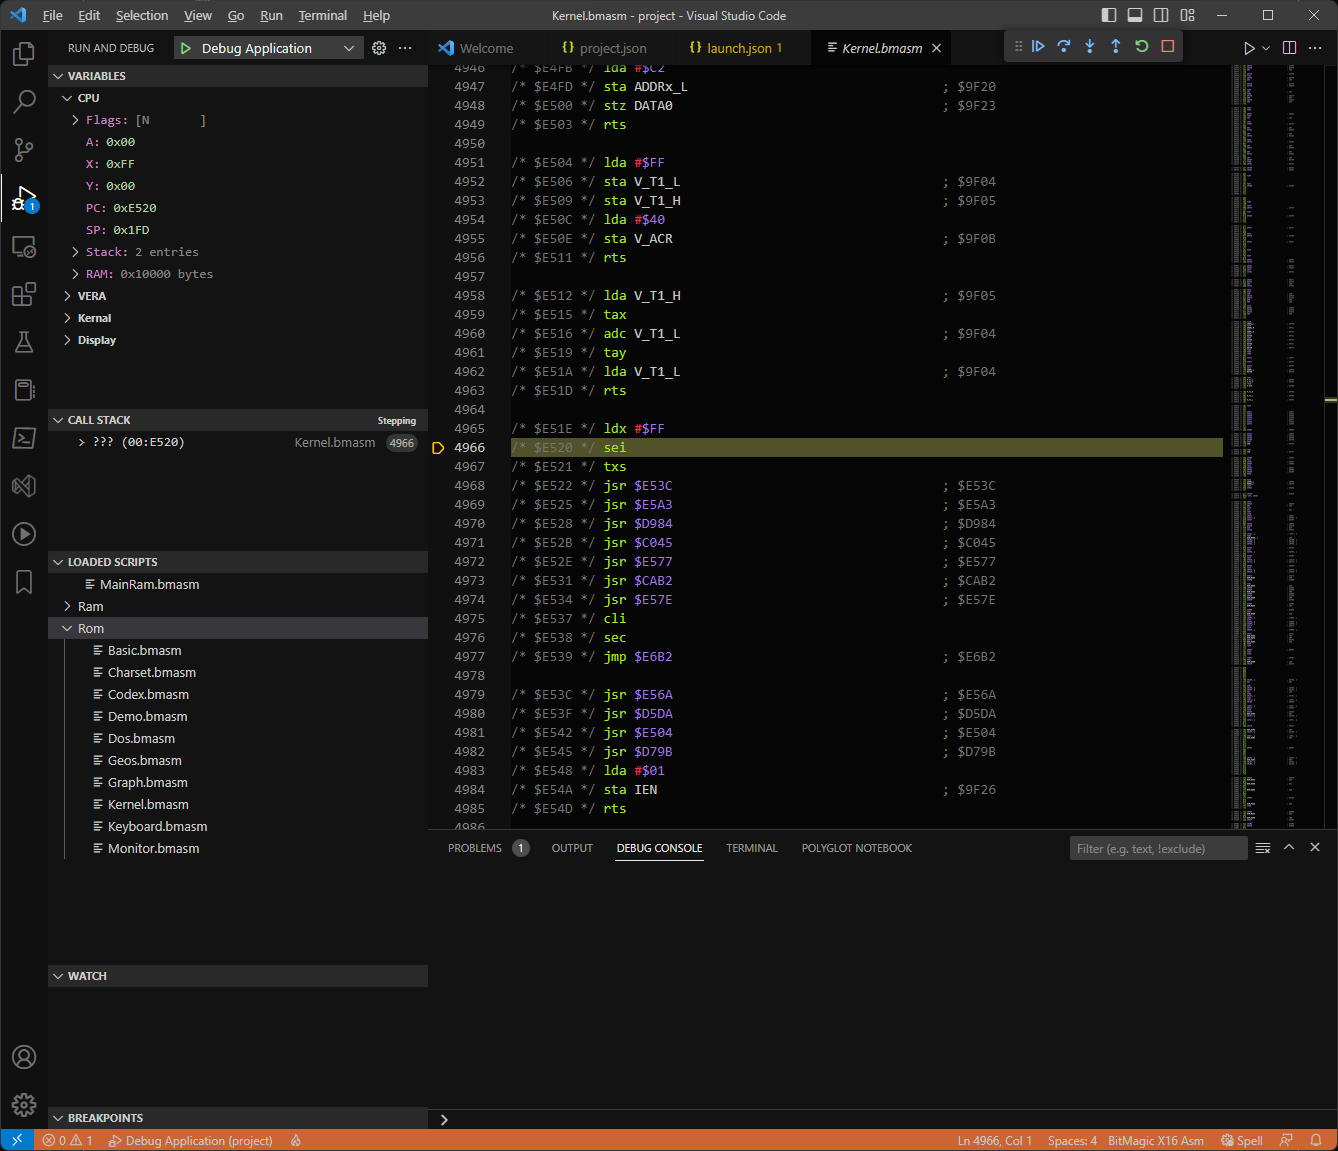
The debugger views
BitMagic adds its own views, each opened from the command palette under the BitMagic category. A view can be opened at any time, but stays empty until a debug session is running.
- BitMagic: Open The History View (CPU History): recent CPU operations.
- BitMagic: Open The Memory Access View (Memory Access View): a visualisation of RAM reads, writes and execution, plus a value search.
- BitMagic: Open The Layer View (Layer Viewer): what each VERA layer is rendering.
- BitMagic: Open The Sprite Viewer (Sprite Viewer): all 128 sprites and their attributes.
- BitMagic: Open The CPU Profiler View (CPU Profiler): where in the frame your code runs, coloured by rule.
Two related topics are not separate views:
- Watches and Breakpoints: expressions, conditional and hit-count breakpoints, and logpoints, in the standard VSCode debug panels.
- Multiline Template Code: stepping through code generated from a macro string.
- Copilot Tools: let GitHub Copilot Chat read sprites, layers, palette and memory from your running session.
For a ca65 program instead of .bmasm source, see ca65 Projects.