Memory Viewer
The memory view visualises how the system is using memory, and lets you search RAM for where a value is stored.
How to open
Open the command palette and run BitMagic: Open The Memory View. See VSCode’s command documentation to customise how you access it.
Memory view visualisation
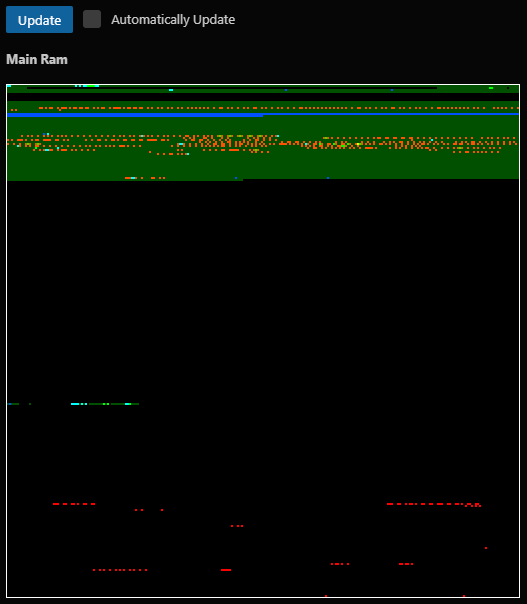
The Main Ram image is 256x256 pixels, one pixel per memory location in the 64KB the CPU can address.
Click Update and the image refreshes to show every read, write and execution location since the last click.
Because the view only shows changes since the last click, you can use it to see what a function touches: set a breakpoint before a KERNAL call, click Update, step over the call, then click Update again to see everywhere it touched.
There’s also an Automatically Update checkbox, which requests changes as fast as possible. There’s no synchronisation while it runs, but it gives you a real-time view of the machine.
Colours
Each pixel can show any of the following states:
- Dark green: a location written to at some point in the past. Good for spotting unused RAM.
- Light green: a location written to in this update.
- Blue: a location read from in this update.
- Red: a location executed from in this update. Only the opcode is coloured, not its parameters.
Colours combine, so a yellow pixel means a write and an execution both happened there, and a cyan pixel means a read and a write both happened.
Memory value search
Below the visualiser are controls to search RAM for a value.
Starting value
First make sure the debugger is paused.
Tell the debugger what size value you’re looking for: byte or word.
Enter a value to match, or leave it blank to start from every location that’s been written to at least once.
Let the debugger run until whatever you’re looking for happens.
Iterations
Pause the debugger.
From here, narrow the results by finding which addresses are now:
Equal: equal to the value entered.Not Equal: not equal to the value entered.Less Than: less than the value entered.Greater Than: greater than the value entered.Changed: the value has changed.Not Changed: the value hasn’t changed.Gone Up: the value has increased.Gone Down: the value has decreased.
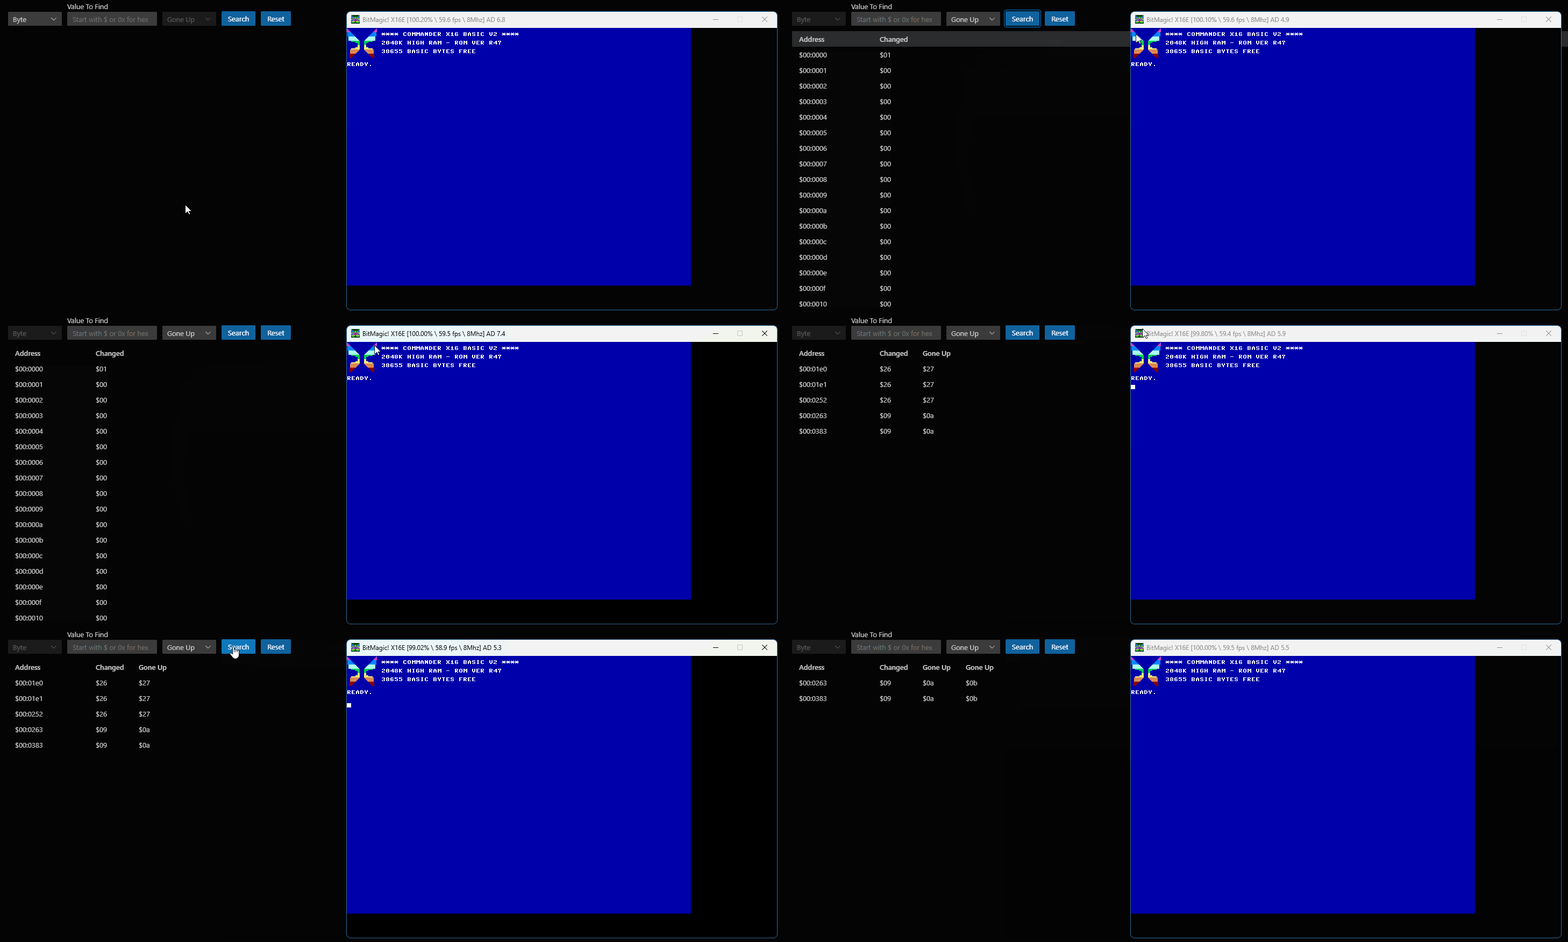
Select the search type from the dropdown, optionally set a value to compare against, then click Search. This narrows the results and adds a column with the new value.
Repeat until you’ve narrowed it down to the address you’re after.
Click Reset to start over.
For example, here’s a search for the memory address of BASIC’s cursor row: