MCP Agent
X16M is an MCP server that lets an AI agent, Claude Code or any other MCP client, drive a BitMagic debug session itself: launching a project, setting breakpoints, stepping, and inspecting memory, the same way VSCode does via BitMagic.X16Debugger. It can also just compile a project or a single .bmasm file and report errors, with no session involved at all - see Compiling without a session.
What it’s for
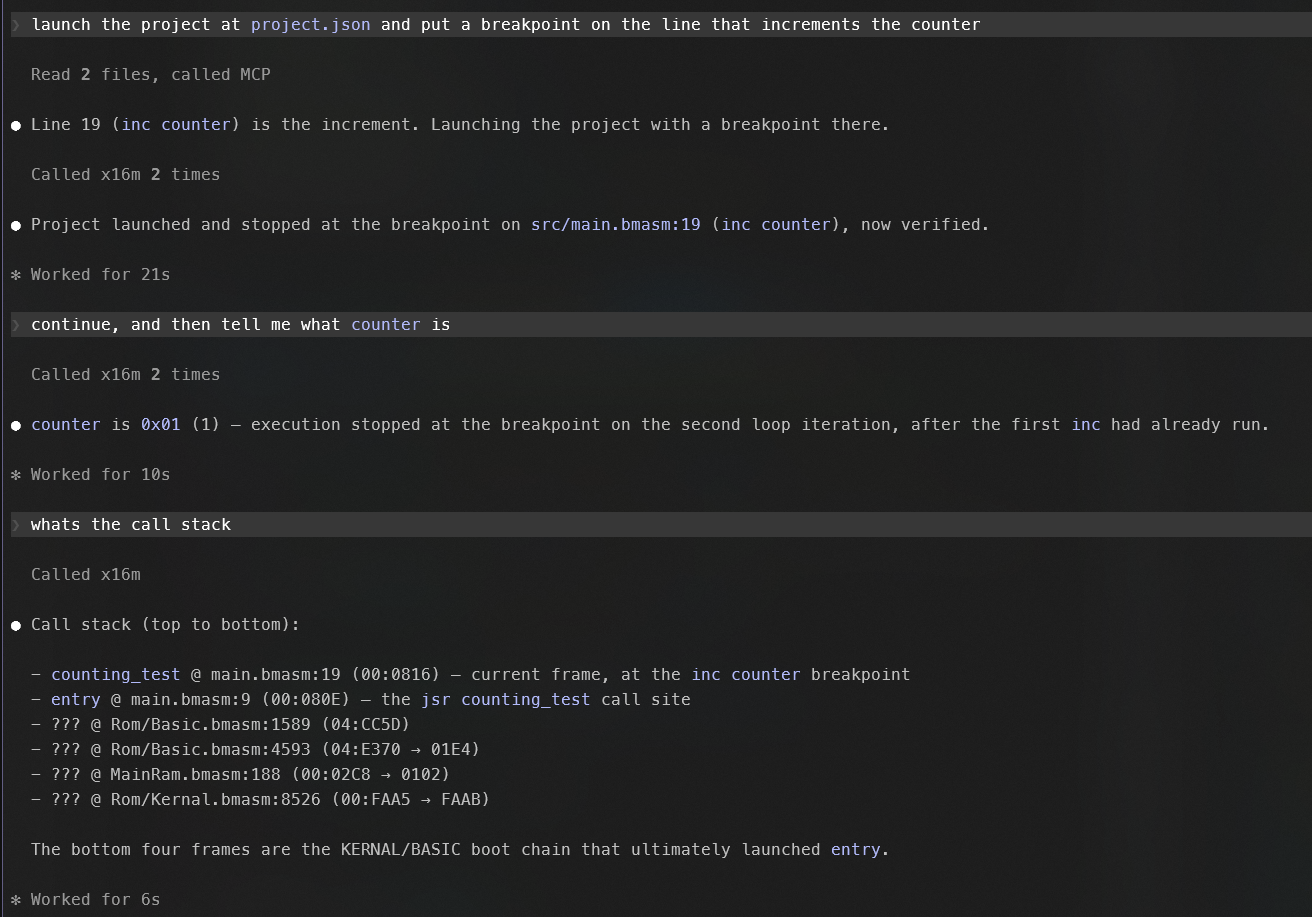
Normally you run the debugger and describe what you see to an agent. X16M lets the agent drive the session directly instead. Ask it in plain English to launch a project, set a breakpoint on a line, and report back what a variable holds once it’s hit; it picks the right calls itself.
X16M doesn’t modify or depend on the debugger’s internals. It speaks the Debug Adapter Protocol (DAP) to X16D, either spawning it as a child process (stdin/stdout, exactly as VSCode does) or connecting over TCP to one already running with --dapport, and re-exposes a subset of DAP as MCP tools.
Getting started
There are two ways to get X16M, and each registers with an MCP client slightly differently.
Install as a .NET tool
If you have the .NET SDK installed, this is the simplest route:
dotnet tool install -g BitMagic.X16M
This puts x16m on your PATH, so registering it with Claude Code is a direct command:
claude mcp add x16m --scope user -- x16m
A .NET tool doesn’t auto-update. To pick up a newer version later, run
dotnet tool update -g BitMagic.X16M.
Download a build
Get the latest build directly: Windows or Linux.
claude mcp add stores the command exactly as given, and Claude Code doesn’t necessarily launch it from the directory you were standing in when you registered it, so the path must be absolute, not .\X16M.exe or ./X16M. From inside the extracted release folder, expand it to an absolute path with the shell itself:
# Windows (PowerShell)
claude mcp add x16m --scope user -- "$PWD\X16M.exe"

# Linux
claude mcp add x16m --scope user -- "$(pwd)/X16M"
Either way it bundles a copy of X16D alongside it, so there’s nothing else to configure beyond a ROM, and the registration lives in your own ~/.claude.json, never in a project file.
Scopes
Register X16M with the CLI rather than a project .mcp.json, since the command (or path) is machine-specific. Two scopes are relevant, and the difference matters:
--scope usermakes X16M available from every project, in every session, on this machine. There’s nothing project-specific about it: X16D and the ROM it talks to are the same regardless of which BitMagic project you’re in, so registering it once per machine is the natural fit. Reach for this one unless you have a specific reason not to.--scope localonly takes effect in sessions launched from the exact directory you were standing in when you ranclaude mcp add. A session started anywhere else, even after a full restart, won’t see it, andclaude mcp listwill still report it as healthy since that check isn’t tied to any one session.
If you registered it before and claude mcp list shows a relative path, a “Conflicting scopes” warning, or the tools aren’t showing up despite a full restart, remove the bad entry (or entries, if it’s registered in more than one scope) and re-add it: claude mcp remove x16m --scope <scope>, then one of the commands above.
Other MCP clients
Other MCP clients typically want the equivalent of a .mcp.json entry, with command set to x16m if you installed the .NET tool, or the absolute path to X16M.exe (X16M on Linux) if you downloaded a build:
{
  "mcpServers": {
    "x16m": {
      "command": "x16m"
    }
  }
}
X16M runs the copy of X16D bundled alongside it by default, and that’s the one to use: X16M’s tools are built and tested against that exact build. --x16d <path-to-X16D.exe> and --x16d-host/--x16d-port exist for X16M’s own development (stepping into X16D itself from a debugger), not as a general-purpose option: pointing X16M at a different X16D build (an older release, a local build, or the one your VSCode extension uses) risks a version mismatch between what X16M expects and what it’s actually talking to.
Available tools
Standard DAP is covered, plus X16-specific tools for VERA layers/sprites/palette, hardware breakpoints, CPU history, memory scanning, keyboard/mouse input, and recording the audio output.
| Tool | Description |
|---|---|
launch_project(projectPath, breakpoints?, stopOnEntry?, muteAudio?) |
Launches a project’s .json file, or a .bmasm file directly. Stops the target at its very first instruction by default (stopOnEntry: true) - the recommended flow from here is set_breakpoints, then continue_execution. Pass stopOnEntry: false to let it start running immediately instead, in which case strongly prefer passing breakpoints here too rather than a follow-up set_breakpoints call: some targets finish in well under a second, faster than a separate tool call can land. Audio is muted by default (muteAudio: true), overriding the project file’s muteAudio; this only silences the output, emulation is unaffected. |
attach_to_session(workspacePath?) |
Attaches to a debug session VSCode already launched and owns, to view and amend its state rather than control it. Every other tool attaches automatically on first use, so this is only needed to check the connection up front or to re-attach after a disconnect. It needs the extension’s Run debug sessions through the same background process setting on and a session running there. Stepping, breakpoints, continuing and disconnecting stay with VSCode; X16M’s tools are for reading and amending X16 state (memory, sprites, palette, layers, CPU history, audio recording). workspacePath is the project folder to find the session in, and defaults to the current directory. |
set_breakpoints(file, lines[]) |
Sets the full set of source breakpoints for a file, replacing any previously set there. |
get_breakpoints() |
Reports the current verification state of every breakpoint set so far. X16D verifies a breakpoint once its file actually loads, which can happen after set_breakpoints or launch_project already returned. |
set_instruction_breakpoints(addresses[]) |
Sets the full set of breakpoints by raw CPU address, replacing any previously set this way - independent of set_breakpoints’ source lines. Useful for code with no source mapping, or an address reached from more than one line. |
set_hardware_breakpoints(expressions[]) |
Sets X16 hardware breakpoints, replacing any previously set this way: vram(address) breaks on any VRAM read or write at that address (optionally a range, and/or restricted to reads or writes only); vsync()/vsync(frameNumber) breaks on every frame’s vertical sync, or once on a specific frame. Not “break when this function is called” despite the name - set_breakpoints already covers that better. |
set_exception_breakpoints(filters[]) |
Sets which exception conditions stop the target: BRK (a BRK instruction executes, off by default), EXP (an exception raised within code, on by default), FIO (a LOAD returned an error code, on by default). |
get_exception_info() |
Reports which exception breakpoint caused the current stop, and why - call after a stop with reason “exception”. |
continue_execution() |
Resumes a paused session and waits for the next stop. |
pause() |
Pauses a running target immediately and waits for the resulting stop, rather than waiting for a breakpoint or exception. |
step_over() |
Steps over the current line. |
step_into() |
Steps into a call on the current line. |
step_out() |
Steps out of the current function. |
get_stack_trace() |
Returns the current call stack. |
get_variables(scopeName?, frameId?, maxDepth?) |
Lists a debug scope’s variables as an indented tree of name: type = value lines, the same as VSC’s Variables pane. For program symbols the type includes the memory location, e.g. counter: byte ($0810) = 5, so the address can go straight into read_memory/write_memory. Scopes are Globals, Locals and the hardware scopes (CPU, VERA, etc.); call with no scopeName to list them. |
evaluate(expression) |
Evaluates an expression in the current scope. |
disassemble(memoryReference, instructionCount) |
Disassembles instructions from a memory location. |
read_memory(memoryReference, count) |
Reads a block of memory. |
write_memory(memoryReference, address, data, bank?) |
Writes raw bytes to a memory space at a given address, to amend live state (e.g. poke a value to test a theory). data is a plain array of numbers, each 0-255 (e.g. [169, 1, 141, 0, 159]), not base64; X16M encodes it for the debugger. bank is required for rambank/rombank. |
search_memory(memoryReference, pattern, maxResults?) |
Searches a memory space for a value, run on the debugger itself rather than transferring the space first, so it’s practical against something as large as the SD card image. pattern is either plain text (matched case-insensitively) or hex bytes prefixed with $ or 0x. |
find_memory_value(value, searchType, searchWidth, locations?) |
“Cheat Engine” style value scanner across every RAM bank - the way to find where an unknown game variable (health, score, a counter) lives without knowing its address. The first call scans fresh (takes roughly 30-60s regardless of value or searchType - only call it once per hunt); pass the locations it returns back with a new searchType (e.g. “Changed”, “Gone Up”) to narrow down, repeating until only the address you want is left. |
get_layers() |
Returns the current VERA display as six images, one per compositing layer (background, layer 0, layer 1, and sprites at each of their three depth slots). While paused mid-frame this can be a partial image rather than a complete one, since the beam only advances alongside executed CPU cycles. |
get_sprites() |
Returns each sprite VERA currently has enabled (depth != 0), with its attributes and its own cropped image. VERA has a fixed table of 128 sprite slots; disabled ones are omitted rather than returned as 128 mostly-empty entries. |
get_palette() |
Returns the current VERA palette: 256 entries, both as fully-resolved 8-bit RGBA colours (what’s actually rendered) and as VERA’s own raw 4-bit-per-channel values. |
get_cpu_history(count?) |
Returns the most recently executed CPU instructions, most recent first, with register state, flags and source file/line where known. Useful for seeing how execution actually reached the current stop, not just where it is now. |
send_key(key, down) |
Sends a single keyboard event - one key press or release, exactly as a real key would arrive. key matches Silk.NET.Input.Key, e.g. “A”, “Enter”, “ShiftLeft”. |
send_mouse(deltaX?, deltaY?, left?, right?, middle?) |
Sends a single mouse sample: a movement delta plus the mouse’s current button state, exactly as a real mouse would report one. The X16’s mouse is relative (PS/2-style), not absolute - there’s no “move to X,Y”, only “move by this much”. |
start_audio_recording(path) |
Records the running target’s audio output (the VERA PSG and PCM, and the YM2151, mixed) to a 16-bit stereo WAV file at 48828Hz, overwriting any existing file. It’s taken straight from the emulator’s output, so it captures the real audio even when the window is muted, and only covers time the emulator is actually running: nothing is written while stopped at a breakpoint or paused, so the file plays back without gaps. One recording at a time. Use an absolute path; a relative one is only accepted when this session launched the project, and is resolved against the project’s folder. Missing folders are created. Works when attached to a session you don’t own. |
stop_audio_recording() |
Stops the recording and finalises the WAV file, reporting its path and the length recorded (emulated running time only). A recording is also stopped when the session ends. |
disconnect() |
Ends the debug session. |
Compiling without a session
build_project(target, buildFolder?, outputFolder?, binFolder?) is the one tool above that isn’t about a debug session at all: it compiles a project’s .json file, or a single .bmasm/.asm file directly, and reports any errors - no session, no ROM, nothing run. It’s independent of whatever launch_project/attach_to_session state exists, so it’s safe to call at any time, including mid-session, and doesn’t need one to exist first. Use it as a fast compile-check loop while an agent is writing or editing .bmasm: point it at the file, fix whatever it reports, repeat.
outputFolder is where the compiled program (.prg etc) is written - worth setting explicitly when target is a bare source file, since there’s no project file to carry an outputFolder of its own otherwise. binFolder is just the template engine’s own intermediate artifacts (its compiled C#, generated .bmasm), not the compiled program - it rarely needs setting. Both default to a bin folder under buildFolder if omitted.
Each call spawns its own short-lived copy of X16D, separate from any X16D a live session owns.
Resources
Alongside its tools, X16M serves bmasm-syntax, a purpose-written reference to the .bmasm
language and its embedded Template Engine C# - directives, types, labels, scope, expressions,
the BM library, and a worked example. An agent can read it before writing or editing .bmasm
code, without you having to explain the syntax yourself.
Example
Once X16M is registered, you don’t call its tools directly. You ask your agent in plain English, and it picks the right tools for you.
You: Launch the project at
project.jsonwith a breakpoint on the line that incrementscounter.Agent: Launched it with that breakpoint in place;
inc counteris on line 11 ofmain.bmasm. It’s already verified, and the target’s paused at the start.
You: Continue, and tell me what
counteris.Agent: Hit the breakpoint.
counteris0x01.
You: Keep continuing until the program finishes, telling me the counter each time.
Agent:
0x02…0x03… …0x0a; then one more continue ran past the loop intostpand the target terminated. Final value was 10.
Under the hood that’s a single launch_project call with its breakpoints argument set, rather than a separate set_breakpoints afterward, since this program is short enough to run to completion before a follow-up call could land. From there it’s continue_execution and evaluate("counter") repeated until the target reports terminated. If a breakpoint sits in a file that hasn’t loaded yet, get_breakpoints reports it as unverified until it does.
The BitMagic.X16MCP repository has a worked example with a minimal project and a full walkthrough, a good first thing to try after registering X16M.